
// analysis · 05 august 2026
Could Nebius become a trillion-dollar AI hyperscaler?
Nebius grew revenue 684% in a single year, signed $27 billion with Meta, and is now priced as though the trillion-dollar outcome is a matter of time. The filings tell a more interesting story.
01/ Verdict
The thesis is strong. A trillion-dollar outcome is not a conclusion, it is a tail scenario that demands exceptional execution
Most of the bull case for Nebius survives contact with the filings, which is more than can be said for the average viral investment thesis. What does not survive is the leap from well positioned to trillion dollars, and the distance between those two phrases is where the actual work sits.
Nebius’s greatest strength is that it does not have to make a one-way bet on which AI model family wins. If closed models retain their lead, Nebius can benefit from demand for large centralised clusters; if a hybrid structure emerges, from multi-model orchestration and inference; and if open-weight models reach the frontier, from neutral cloud, sovereign deployments and specialised inference demand. In Morgan Stanley’s publicly available summary, Nebius appears, contrary to the viral claim, as a secondary beneficiary in all three scenarios, not just two.[1]
out of 100
02/ Fact check
The core story is directionally right, but several figures and conclusions have been conflated
A viral post can be broadly correct and still be wrong in the places that decide whether you should act on it. Eleven claims went round; the table below puts each one next to what the filings, the official releases and the research actually say.
A Correct label means the factual statement is supported by the sources. It does not mean the investment outcome is certain.
| Claim | Verdict | Verified or corrected reading |
|---|---|---|
| Morgan Stanley identifies Nebius as a beneficiary in two of three scenarios. | Incorrect | In the publicly available summary, Nebius and CoreWeave are shown as secondary beneficiaries in all three outcomes. NVIDIA is the leading beneficiary in each.[1] |
| Q1 2026 revenue was $399M, up 684% YoY. | Correct | Group revenue was $399.0M; core Nebius AI Cloud revenue was $389.7M, or roughly 98% of group revenue. Quarter-end ARR was $1.92B.[2] |
| Contracted backlog is approaching $50B. | Partly | Adding the headline maximum values of the Microsoft and Meta agreements produces approximately $46B to $49B. However, the accounting anchor as of 31 March was RPO $33.585B. Maximum contract value, RPO and future recognised revenue are not the same concept.[3] |
| Meta’s $15B backstop removes demand risk from the entire buildout. | Overstated | The backstop applies to unsold capacity in specified future clusters defined in the agreement. Construction, power delivery, financing, deployment timing, pricing, technology obsolescence and demand risk at other facilities remain.[4] |
| More than 60% of enterprises use open-weight models. | Directionally right | In McKinsey’s survey, 63% of 703 AI-experienced technology leaders and senior developers reported regular use of open-source AI at the model layer. That does not mean 63% of the entire enterprise universe; the sample and the definition of open source also include open-weight and partially open solutions.[5] |
| vLLM and TensorRT-LLM are Nebius’s own software layer. | Misleading | Nebius can integrate and optimise them in production inference, but vLLM is an open-source framework and TensorRT-LLM is part of NVIDIA’s ecosystem. Nebius’s defensible value lies not in owning the frameworks, but in integration, scheduling, reliability and unit economics.[6] |
| Nebius still owns about 28% of ClickHouse; the stake is worth $4B or more. | Outdated | The latest filing does not disclose an exact percentage. The official carrying value as of 31 March, following the January funding-round revaluation, was $1.518B. Multiplying an old ownership percentage directly by a $15B private valuation is unreliable because of dilution and preferred rights.[3] |
| Avride raised $375M of external capital. | Partly | The “up to $375M” total combines strategic investment and commercial commitments from Uber and Nebius. It is not all third-party capital.[10] |
| Nebius has a minority economic stake in Toloka. | Incomplete | Nebius lost majority voting control; according to the filing, its voting interest fell to 49%. The company now refers to a “significant economic interest”, but the exact economic percentage is not clearly disclosed in public materials.[19] |
| Tavily was acquired for about $275M. | Accounting difference | Media headlines used higher figures; under the SEC purchase accounting, the fair value of consideration transferred was $189.7M, with additional contingent and compensatory elements linked to performance and employment.[3] |
| The Eigen AI deal was worth about $643M. | Correct | Nebius announced a transaction with a signing-date value of approximately $643M, comprising cash and Class A shares; the deal closed in June 2026.[9] |
03/ Scenarios
Three possible futures for the AI model market, and three different revenue paths for Nebius
The reason this thesis has legs is not that Nebius has picked the winning side of the model war. It is that the company does not have to pick at all, and the diagram below is the clearest way to see why.
What follows is not a copy of Morgan Stanley’s proprietary research chart. It is an independent analytical reconstruction based on the publicly available news summary dated 3 August 2026.[1]
The three futures, side by side
1 · Closed wins
Workloads concentrate in hyperscalers and frontier labs. Training clusters, optical networks and gigawatt-scale power become critical.
Nebius: dedicated capacity → secondary beneficiary2 · Hybrid market
Closed models handle complex reasoning; open models handle high-volume and domain workloads. The need for routing and orchestration increases.
Nebius: Token Factory and managed inference → secondary beneficiary3 · Open reaches frontier
Inference spreads across private data centres, sovereign cloud and the edge. Local capacity and efficient serving become critical.
Nebius: neutral open-model platform → secondary beneficiaryThe takeaway: Nebius appears on the winning side of all three branches, but never as the primary winner. Important nuance: in the open-weight scenario, on-premises and enterprise hardware vendors such as Dell, HPE and NetApp may benefit more directly. Nebius does not win automatically; it must genuinely differentiate its neutral cloud and software layer.
How Nebius wins in each world
Wins as a capacity provider
Even though customers such as Microsoft and Meta are hyperscalers themselves, power and GPU scarcity can force them to buy third-party AI cloud capacity. That is Nebius’s most visible revenue engine today.
Wins as a platform
In a world where every request does not go to the same model, model selection, evaluation, routing, fine-tuning, guardrails and observability become economically valuable.
Wins as neutral infrastructure
Companies using open-weight models often want production-grade compute and serving without being locked into a proprietary model vendor. That is Nebius’s natural lane.
04/ Open weights
Open models are becoming less an alternative to closed models and more a second engine within the same enterprise stack
The open versus closed framing is the wrong one. Enterprises are not choosing sides, they are running both, and the survey data shows a stack where open components sit underneath proprietary ones at almost every layer.
The research by McKinsey, the Mozilla Foundation and the Patrick J. McGovern Foundation surveyed 703 AI-experienced technology leaders and senior developers across 41 countries. Regular use of open-source AI was 63% at the model layer, 59% at the tools layer and 56% at the data layer.[5]
This matters for Nebius because “free weights” do not make production inference free. GPUs, memory, networking, cache management, autoscaling, reliability, security, evaluation and model optimisation still carry costs. That operational layer is precisely the value pool Nebius is targeting.
Regular open-source use across the AI stack
Adoption is highest where the model itself sits and falls away sharply at the layers that cost money to run: hosting, inference and model modification.
McKinsey survey of respondent organisations, 2025. Percentages do not exclude using open and proprietary tools together across different layers.
Why an enterprise reaches for an open model
Speed
For high-frequency workloads, per-token economics, latency and throughput may favour a smaller model or an optimised open model.
Control
Regulated industries and sovereign workloads may demand greater control over model behaviour, data locality and deployment architecture.
Customisation
For domain-specific use cases, fine-tuning, distillation and model routing may be more economical than relying on a single frontier API.
05/ Full stack
Nebius’s real ambition is not merely to rent GPUs; it is to own the economic control points of the AI production stack
Renting GPUs is a commodity business with a bad ending, and Nebius knows it. Everything the company has bought or built in the past year points at the layers where margin survives a price war.
By its own description, Nebius combines a proprietary cloud software architecture with in-house server, rack and data-centre design, which is the part of an AI factory buildout that most operators specify rather than design. Token Factory provides pay-per-token and managed deployment for open models, while Tavily’s agentic search, Eigen AI and Clarifai inference IP move the stack further upwards.[6]
The five layers, from land to tokens
Power and data centre
Land, grid access, greenfield construction, cooling and high-density deployment.
Owned / leased / partnerServers, racks, network
In-house hardware design, supply chain, high-speed fabric and cluster operations.
Nebius designAI cloud platform
Compute, storage, Kubernetes, observability, security, scheduling and developer services.
Proprietary layerToken Factory
60+ open models, OpenAI-compatible API, fine-tuning, autoscaling and optimised endpoints.
Managed productAgentic and optimisation
Tavily search, Eigen model and system optimisation, licensed Clarifai inference IP.
Acquired / licensed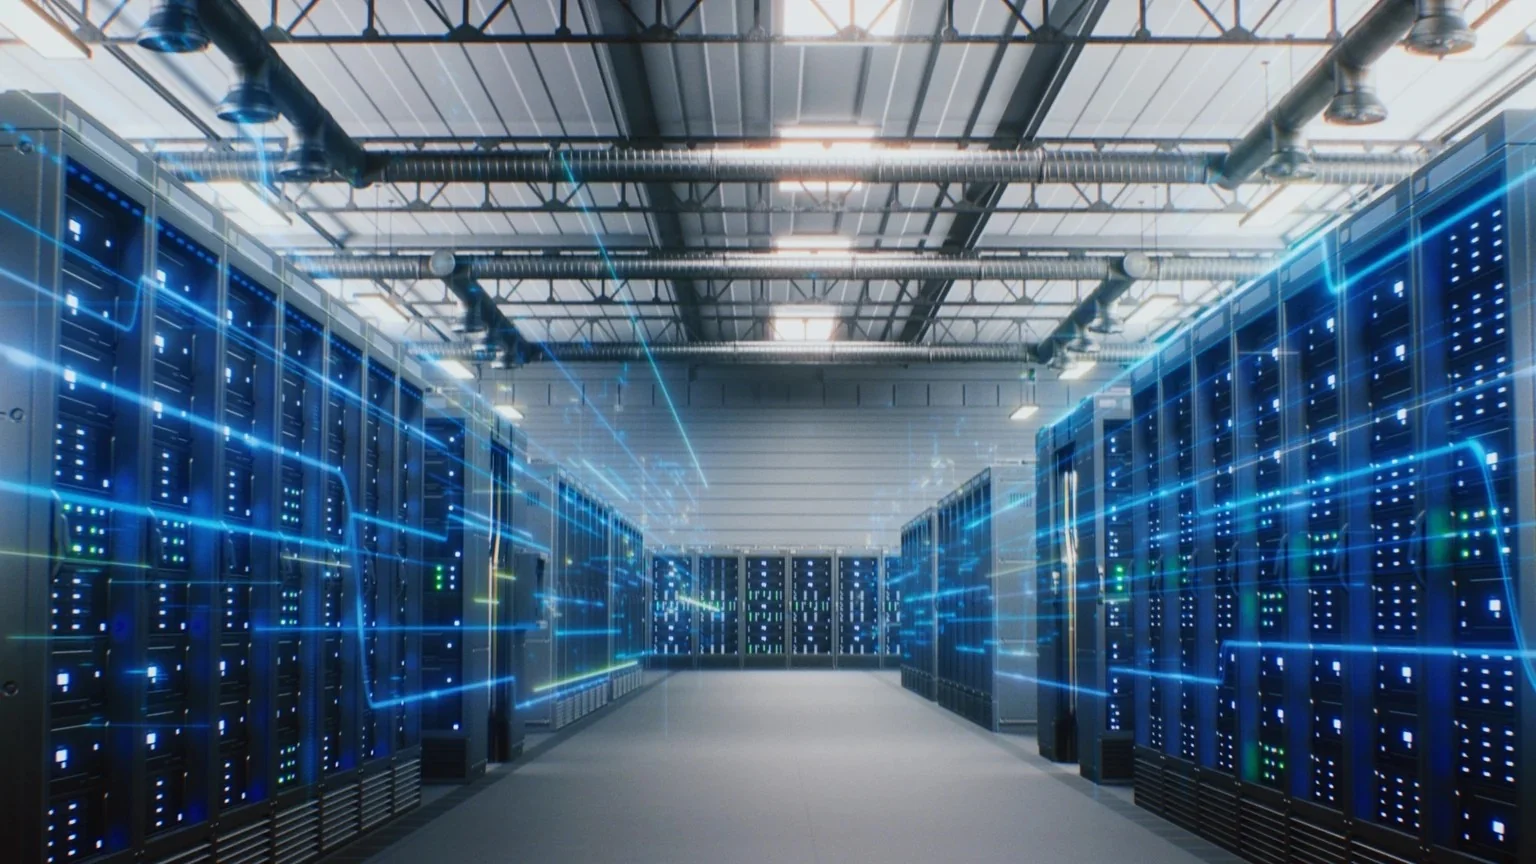
Where could the moat emerge?
The moat may come not only from GPU access, but from operational learning that delivers more tokens per second, higher utilisation, lower latency, fewer incidents and faster model onboarding on the same hardware. If those gains improve customer unit economics, Nebius can move away from bare-metal price competition.
What remains unproven?
The company does not yet regularly disclose Token Factory’s standalone revenue, gross profit, customer count or ARR contribution. The claim that the “software layer creates high margins” is therefore a plausible strategic hypothesis, not a fact fully demonstrated by segment financials.
06/ Financials
Growth is extraordinary, and so is the capital requirement
Q1 2026 was the first genuinely large-scale quarter in Nebius’s ramp-up, and it is the quarter where the two halves of this company become visible at once: revenue compounding at a rate almost nothing else in public markets can match, and a capital bill six times larger than the revenue it produced.
Revenue and adjusted EBITDA rose rapidly, while capex, depreciation, debt and lease commitments expanded at the same time. Valuing the company solely on revenue growth or adjusted EBITDA would therefore miss a substantial part of the economics.
Q1 scale comparison
US$ billions; visual scale normalised to capex.
Interpretation: Q1 capex was approximately 6.2 times revenue for the same quarter. That is not inherently negative, because the capacity is being built for future revenue. But capital productivity must sit at the centre of the investment thesis.
RPO recognition schedule
$33.585B of unsatisfied RPO as of 31 March 2026; includes estimates of variable consideration and may change.
Most of the backlog lands beyond the next two years, so near-term revenue depends on delivery, not on the headline.
Microsoft up to $19.4B[12] plus new Meta up to $27B; varies depending on whether the earlier approximately $3B Meta agreement is included.
Unsatisfied remaining performance obligations. Subject to timing, performance constraints and estimates of variable consideration.
According to the Q1 shareholder letter, contracted power exceeded 3.5GW and year-end guidance was above 4GW. By contrast, expected connected power was only 800MW to 1GW by the end of 2026. The economic funnel is: contracted power → connected data centre → active IT load → installed GPUs → customer acceptance → billable utilisation.[20]
Why does cash flow look deceptively strong?
Q1 operating cash flow was $2.258B, driven mainly by a $3.198B increase in deferred revenue, which is prepayment received for services to be delivered in the future. This can be an excellent financing advantage, but it is also a future delivery obligation.[3]
Why does net income not represent operating performance?
Q1 net income from continuing operations was $621.2M, but included a $780.6M non-cash revaluation gain on the ClickHouse investment. Trailing P/E or net income is therefore not a useful way to assess the core cloud economics.[3]
The balance sheet in three numbers
$9.3B cash
Cash and cash equivalents were $9.298B as of 31 March. Liquidity is strong, but a significant portion should be assessed alongside customer advances and new financing.
$8.45B debt
Current and non-current debt totalled approximately $8.45B. In July, the company also announced a $775M secured facility backed by GPU assets and contracted cash flows.[13]
$9.9B future leases
Undiscounted future payments under data-centre leases that had not yet commenced were approximately $9.905B, with an average lease term of 11 years.[3]
07/ Meta backstop
The $27 billion Meta agreement reduces demand risk. It does not eliminate all risk
This is the single claim that did most of the work in making the thesis go viral, and it is the one that needs the most care. A backstop is a real thing with a real perimeter, and the perimeter is narrower than the retelling.
The five-year structure has two parts: $12B of dedicated NVIDIA Vera Rubin capacity, due to begin delivery in early 2027; and an obligation for Meta to buy up to $15B of capacity in specified new clusters that cannot be sold to third parties.[4]
Risks it genuinely reduces
- The risk that specified clusters remain idle
- Difficulty securing debt or asset-backed financing for the buildout
- Initial demand visibility for new Vera Rubin deployments
- Potential customer diversification when capacity is sold to third parties
Risks it does not eliminate
- Grid connection, permitting, construction and commissioning
- GPU procurement, networking, cooling and on-time delivery
- Financing costs, leverage and refinancing
- Technology obsolescence and future pricing compression
- Utilisation of clusters outside the agreement
- Customer concentration around Meta and Microsoft
08/ Capital model
The key to the trillion-dollar thesis may be the shift towards an asset-light model announced in July 2026
Capital-heavy lessors do not get platform multiples, and no amount of revenue growth changes that. The July announcements are the first serious attempt to move Nebius out of that category, which makes them more consequential than any single contract.
Partner-owned infrastructure
Under Nebius’s new model, the partner finances and owns the facility and hardware, and operates the data centre. Nebius supplies the systems architecture, hardware design, cloud software, service levels and go-to-market. Economics may include revenue share, licensing fees, commissions or committed capacity.[14]
Why this matters: if the company can extend the same software and control plane into more regions with less incremental capital, its valuation multiple could move away from that of a capital-heavy lessor and towards a platform business.
Asset-backed financing
The approximately $775M senior secured facility announced in July is backed by deployed GPU infrastructure and contracted cash flows from investment-grade customers; pricing is SOFR plus 2.50%, with maturity in October 2030. The company says customer cash flow, together with the financing, covers more than 100% of the underlying deployment capex.[13]
Why this matters: if a cycle of contract, then asset financing, then freed corporate capital, then new capacity can be established, pressure from equity dilution may decline.
09/ Portfolio
The ancillary assets carry real value, but they are not a standalone bridge to $1T
Every bull case for Nebius eventually reaches for the side assets, and they do carry real value. They also add up to a rounding error against the number this article is testing.
ClickHouse
Open-source real-time analytics database. Following the January 2026 funding transaction, Nebius revalued its investment upwards by $780.6M. This is not a liquid market value; exit timing and preferred rights matter.
Avride
Robotaxis and delivery robotics. Commercial rides launched through Uber in Dallas; a monitoring specialist was present in the vehicle during the initial rollout. Significant optionality, but high execution and regulatory risk.
TripleTen
Technology-reskilling edtech platform. Small relative to the core AI cloud; cash burn, strategic fit and potential monetisation paths should be monitored.
Toloka
AI data and human-validation platform. Nebius lost control but retained a significant economic interest. The exact economic percentage and future dilution should be monitored explicitly.
Up-stack M&A across the AI stack
Tavily
Agentic search infrastructure. SEC fair value of consideration transferred: $189.7M; additional performance and retention components apply.
Clarifai IP and core team
Token Factory’s optimisation capabilities were strengthened through inference IP licensing and the transfer of the core engineering team.
Eigen AI
Approximately $643M signing value. Model, systems and kernel-level inference optimisation.
Asset-light platform
Licensing and operating Nebius architecture and software stack on third-party data centres.
10/ The maths
Can Nebius reach $1 trillion? The maths is far harder than the story
This is where the thesis stops being a narrative and becomes arithmetic, and the arithmetic is unforgiving. Every route to $1 trillion demands a revenue figure that would put Nebius among the largest infrastructure businesses on earth.
Value increase required to move from today’s approximately $54.0B market capitalisation to $1 trillion.
This is not merely a rise in the share price. Share count, future dilution, warrants and M&A consideration will also affect the ultimate shareholder return.
Revenue required for a $1T valuation
Illustrative terminal sales multiple; not a forecast.
| Terminal value / sales (simplified) | Required annual revenue | vs 2026 guidance midpoint |
|---|---|---|
| 6× | $166.7B | 52.1× |
| 8× | $125.0B | 39.1× |
| 10× | $100.0B | 31.3× |
| 12× | $83.3B | 26.0× |
Even the most generous multiple still asks Nebius to grow revenue 26 times over from the 2026 guidance midpoint.
CAGR required from 2026 midpoint to 2035
Starting point: $3.2B revenue-guidance midpoint; nine-year period.
The lower the multiple the market is willing to pay, the more brutal the growth requirement becomes. Nothing here is impossible; all of it is rare.
Three routes to the same number
Capacity case
Nebius becomes a multi-gigawatt global AI infrastructure supplier, but low differentiation and capital intensity keep the terminal multiple constrained. This scenario requires the highest revenue to reach $1T.
Hyperscaler case
Compute, storage, networking, managed services and enterprise reliability scale; the customer mix diversifies. A higher multiple becomes possible, though revenue of around $100B may still be required.
Platform case
Token Factory and partner-operated Nebius cloud generate capital-light software economics. This is the scenario most likely to justify the highest multiple, and the one with the least financial evidence today.
11/ Bull vs bear
The strongest investment thesis, and the fault lines that could break it
Both columns below are drawn from the same filings. That is the honest position on Nebius: the bull case and the bear case are not competing readings of the evidence, they are the same evidence weighted differently.
Bull case
Closed, hybrid or open-weight: every path consumes compute, network and power.
Grid-ready land, power, GPU supply and operating capability are not easily replicated in the near term.
Microsoft, Meta and new AI-native customers provide revenue visibility and financing collateral.
Hardware design plus cloud control plane plus inference optimisation could create a margin pool above bare metal.
Partner-owned sites could globalise the Nebius platform with less corporate capex.
A $2B strategic investment is a strong signal for supply-chain and technical collaboration.
Bear case
The $20B to $25B 2026 capex guidance is far above the $3.0B to $3.4B revenue guidance.
A procurement, timing or strategy change at a small number of hyperscalers could have a major effect.
Contracted MW, connected MW, active GPUs and billable utilisation are not the same.
New GPU generations, custom silicon and inference efficiency could weaken the economics of older capacity.
Token Factory’s standalone revenue and margin contribution are not yet disclosed.
At roughly 16.9× the 2026 guidance midpoint on market-cap/revenue and about 28× quarter-end ARR, the valuation already embeds high expectations.
12/ What to watch
Which KPIs will show whether the thesis is working?
Revenue growth is the least informative number Nebius reports, because at this stage of a buildout it is almost guaranteed. These nine tell you whether the capital is actually working.
RPO conversion
Speed of RPO conversion into revenue, changes in cancellation and variable consideration, and customer acceptance.
Connected and active MW
Not contracted power, but energised, GPU-installed and revenue-generating capacity.
Revenue per MW and per GPU
Pricing, mix, utilisation and productivity of new-generation hardware.
GAAP margin after D&A
Operating margin, free cash flow and ROIC alongside adjusted EBITDA.
Customer concentration
Top-two customer share and diversification across enterprise and AI-native customers.
Token Factory attach
Inference revenue, tokens served, customer count, retention and gross-profit contribution.
Asset-light mix
Revenue from partner capacity, margin, capex avoidance and SLA performance.
Debt and dilution
Interest burden, secured-financing terms, convertible dilution, warrants and share-based M&A.
M&A integration
Product adoption, performance and monetisation from Tavily, Eigen and Clarifai IP.
13/ Conclusion
Nebius has a credible path to becoming a major AI hyperscaler; $1 trillion is not yet the base case
Strip out the excitement and one question decides this: whether the inference layer earns a genuine software margin, or settles into the same commodity economics that already govern where it makes sense to run AI workloads at all. Everything else is execution.
The evidence today suggests that Nebius is trying to build more than a conventional GPU lessor: in-house infrastructure design, a proprietary cloud control plane, open-model inference, agentic search, optimisation IP, long-term hyperscaler contracts and a new asset-light partnership model all connect to the same strategy. Its ability to benefit across all three Morgan Stanley scenarios is the strongest part of the thesis.
But to reach $1T, Nebius would need not only enormous capacity in the 2030s, but hyperscaler-quality economics. That means reducing customer concentration, approaching roughly $80B to $170B of annual revenue, generating high returns on invested capital after depreciation and financing costs, and proving that the software and inference layer constitutes a genuine margin moat.
The accurate formulation is therefore: not “Nebius will definitely become a trillion-dollar company”, but “Nebius is unusually well positioned for multiple directions in the model market, yet still faces enormous capital, execution and platform-monetisation tests before a trillion-dollar outcome becomes credible”.
FAQ/ Questions people actually ask
Questions people actually ask about Nebius
What is Nebius?
Nebius Group is a NASDAQ-listed AI infrastructure company that builds and rents large-scale GPU clusters, and sells inference and platform services on top of them. It reported $399.0M of group revenue in the first quarter of 2026, roughly 98% of which came from its AI cloud business, and it ended the quarter with $1.92B of annualised run-rate revenue.
How much revenue would Nebius need to justify a $1 trillion valuation?
Between roughly $83B and $167B a year, depending on the sales multiple applied. At 12 times sales the figure is about $83.3B, at 6 times sales it is about $166.7B. Starting from the $3.2B midpoint of 2026 guidance, reaching those levels by 2035 would require a compound annual growth rate of between 43.6% and 55.1%.
Does the $27 billion Meta agreement remove Nebius's demand risk?
No. The five year structure has two parts: about $12B of dedicated NVIDIA Vera Rubin capacity due to begin delivery in early 2027, and an obligation for Meta to buy up to $15B of capacity in specified new clusters that cannot be sold to third parties. It reduces demand risk for that named capacity. It does not underwrite the rest of the buildout, and it concentrates counterparty risk on a single customer.
Is Nebius's contracted backlog $50 billion or $33.6 billion?
The accounting anchor is $33.585B of remaining performance obligations as of 31 March 2026. The figure close to $50B comes from adding the headline maximum values of the Microsoft and Meta agreements, which produces roughly $46B to $49B. The two are different measures and should not be used interchangeably.
14/ Method
Research approach and limitations
An article that spends its second section correcting someone else’s numbers owes the reader its own working. Here is where each figure came from and where the reconstruction stops.
Source priority
SEC filings and company press releases were treated as primary sources; McKinsey research for adoption data; Reuters for transaction values and the current capex context; and Blockspace for the public summary of Morgan Stanley’s 3 August 2026 research.
Morgan Stanley limitation
Because the full proprietary report and original chart are not public, the scenario diagram in this article is not a line-for-line reproduction. It is an analytical reconstruction from publicly available text.
Market capitalisation
The approximately $54.0B figure multiplies the $212.58 price on 4 August 2026 by 253.898M shares outstanding as of 31 March 2026. Prefunded warrants, options, RSUs and subsequent changes could produce a different fully diluted value.
Valuation scenarios
The 6× to 12× sales multiples and 2035 CAGR calculations used for the $1T scenarios are purely illustrative sensitivity analyses; they are not a price target or investment recommendation.
Data currency
Because Q2 2026 results are due on 12 August 2026, the latest financial period in this report is Q1 2026.[15]
15/ Sources
Primary and supporting sources
Twenty-one sources, filings first. Where a claim rests on a company statement rather than an audited number, the text says so.
- Morgan Stanley says open-weight AI could expand compute and power demandBlockspace, 3 August 2026. Public summary of the three scenarios.
- Nebius reports first quarter 2026 financial resultsSEC Exhibit 99.1. Revenue, adjusted EBITDA, cash flow, shares.
- Unaudited condensed consolidated financial statements, Q1 2026SEC Exhibit 99.2. RPO, deferred revenue, debt, leases, ClickHouse, Tavily, accounting policies.
- Nebius signs new AI infrastructure agreement with MetaOfficial release, 16 March 2026. $12B dedicated plus up to $15B unsold-capacity arrangement.
- Open source technology in the age of AIMcKinsey, Mozilla Foundation and Patrick J. McGovern Foundation, April 2025.
- AI model inference on Nebius: Token FactoryOfficial product page. 60+ models, OpenAI-compatible API, managed inference.
- Nebius to triple capacity at its Finland data centre to 75 MWOfficial release. Site-level capacity expansion. Relabelled: the original document cited this URL as evidence of full-stack architecture and in-house hardware design, which it does not support.
- Nebius announces agreement to acquire TavilyOfficial release, February 2026. Agentic-search strategy; see source 3 for the purchase accounting.
- Nebius agrees to acquire Eigen AIOfficial release, 1 May 2026. Approximately $643M signing value.
- Avride secures up to $375M backed by Uber and NebiusOfficial release, October 2025.
- Uber and Avride launch robotaxi rides in DallasOfficial Uber release, December 2025.
- Nebius signs $17.4B AI infrastructure deal with Microsoft, potential $19.4BReuters, September 2025.
- Nebius raises $775M in first secured debt financingOfficial release, 17 July 2026.
- Nebius introduces a business model to scale its AI cloud through infrastructure partnershipsOfficial release, 15 July 2026.
- Nebius Group N.V. announces date of second quarter 2026 results and conference callOfficial release. Results due 12 August 2026.
- Nebius reports higher quarterly capex on AI cloud expansionReuters, 13 May 2026. Context for the $20B to $25B 2026 capex guidance.
- Nebius expands in the UK with more NVIDIA-powered infrastructureOfficial release, June 2026. £1.7B, 65MW and Revolut production use cases.
- NBIS market data4 August 2026 price reference. The market capitalisation calculation is approximate and static.
- Toloka deconsolidation and retained interestsSEC Q1 2026 financial statements, the same filing as source 3. 49% voting interest and retained securities.
- Nebius Q1 2026 letter to shareholdersOfficial shareholder letter. 2026 guidance, the distinctions between contracted, connected and active power, and capacity expansion.
- AI startup Reflection signs over $1B computing deal with NebiusReuters, 14 July 2026. NVIDIA-backed compute capacity for an open-model builder.