
// AI economics · power, cooling and the megawatt
Tokens per Watt: AI Has a New Currency. Who Is Counting Honestly?
Illustration, AI generated.
Power, not chips, now caps how much AI a provider can sell. Tokens per watt measures that ceiling, if you count the right tokens inside the right boundary.
Two hypothetical facilities, both capped at 10 MW, run in the background while you read. They use the same electricity. One turns it into 46% more output. You will meet both in the 10 MW lab. Illustrative figures, not a measurement of any real site.
Late in 2025, the chief executive of one of the most valuable companies on earth admitted to a problem that money could not immediately fix. Satya Nadella told the BG2 podcast that Microsoft risked having “a bunch of chips sitting in inventory that I can’t plug in.” Then he made it plainer: “It’s not a supply issue of chips. It’s actually the fact that I don’t have warm shells to plug into.”[1]
For most of the generative AI boom, the scarce thing was the accelerator. Nadella was describing the moment the scarcity moved, from the order book to the substation, from the chip to the megawatt. When that happens, the question every AI business has to answer moves with it, and so does the number it should be judged by.
Cost per token has become a familiar language for AI economics. It helps providers price services, developers compare models, and infrastructure teams evaluate the cost of producing output. But a token price cannot, by itself, answer a question that increasingly determines whether an AI business can scale: how much useful work can we deliver from the electrical and cooling capacity we can actually obtain?
My view is that the next phase of AI infrastructure competition will increasingly be shaped by this physical constraint. Access to accelerators remains important. So do capital, software and model quality. Yet an accelerator only creates economic value when it can run, within a viable operating envelope, on work that someone needs.
This is why tokens per watt deserves a place beside cost per token. The argument is strongest when it connects energy efficiency to productive capacity, and then connects that capacity to successful outcomes. Electricity can constrain growth even when it is not the largest item on the cost sheet.
The industry is already moving in this direction. NVIDIA’s current tokenomics guide explicitly discusses throughput per megawatt alongside cost per token. The unresolved challenge is how to make those comparisons meaningful across complete systems and actual workloads.[2] There is also a pleasing irony in the name. The watt in the denominator honours James Watt, whose steam engine gave the industrial world one of its first great efficiency sales pitches and its most famous efficiency paradox. Both turn up later in this story, and both have more to teach a modern AI provider than most benchmark charts.
01/ Power limits
Power is becoming a constraint on what can be built
Start with scale, because scale is what turned a facilities problem into a boardroom one. The International Energy Agency’s 2026 update estimates that global data centres consumed 485 TWh of electricity in 2025, an increase of 17% in a year. Consumption at AI-focused data centres increased by 50%. Its central projection reaches approximately 950 TWh for all data centres in 2030, around 3% of global electricity demand. The 2030 figure is a projection, and both sector totals include AI and conventional data-centre workloads.[3]
A global percentage does not describe the pressure on an individual network. Data centres concentrate substantial demand at particular locations. Ireland illustrates the difference: its Central Statistics Office reports that data centres accounted for 23% of the country’s metered electricity consumption in 2025. That is an observed national concentration, rather than a forecast of AI’s global share.[4]
Hardware arrives on a different calendar from the grid
The timing mismatch matters just as much as the volume. The IEA’s Electricity 2026 report describes grid infrastructure development taking five to fifteen years, compared with one to three years for a data centre. These are broad development ranges, but they explain why the availability of hardware and the availability of a grid connection can follow very different schedules.[5]
The race nobody scheduled
Start a data centre and its grid connection on the same day. Press play, or drag the years yourself.
Both projects start on the same day.
Great Britain’s connection queue shows why announcements need to be distinguished from operating capacity. Ofgem’s July 2026 consultation identified approximately 73 GW of contracted data-centre demand in the June 2025 connection queue. The figure includes projects that may never become operational, and Ofgem identifies speculative developments as a source of distorted planning signals.[6]
The commercial implication follows from these constraints. A provider might be able to finance another cluster and secure the equipment, yet have no usable power allocation for it at the required site and date. Equally, a building may have sufficient aggregate electrical capacity but lack the distribution equipment or cooling capability needed for the proposed rack density.
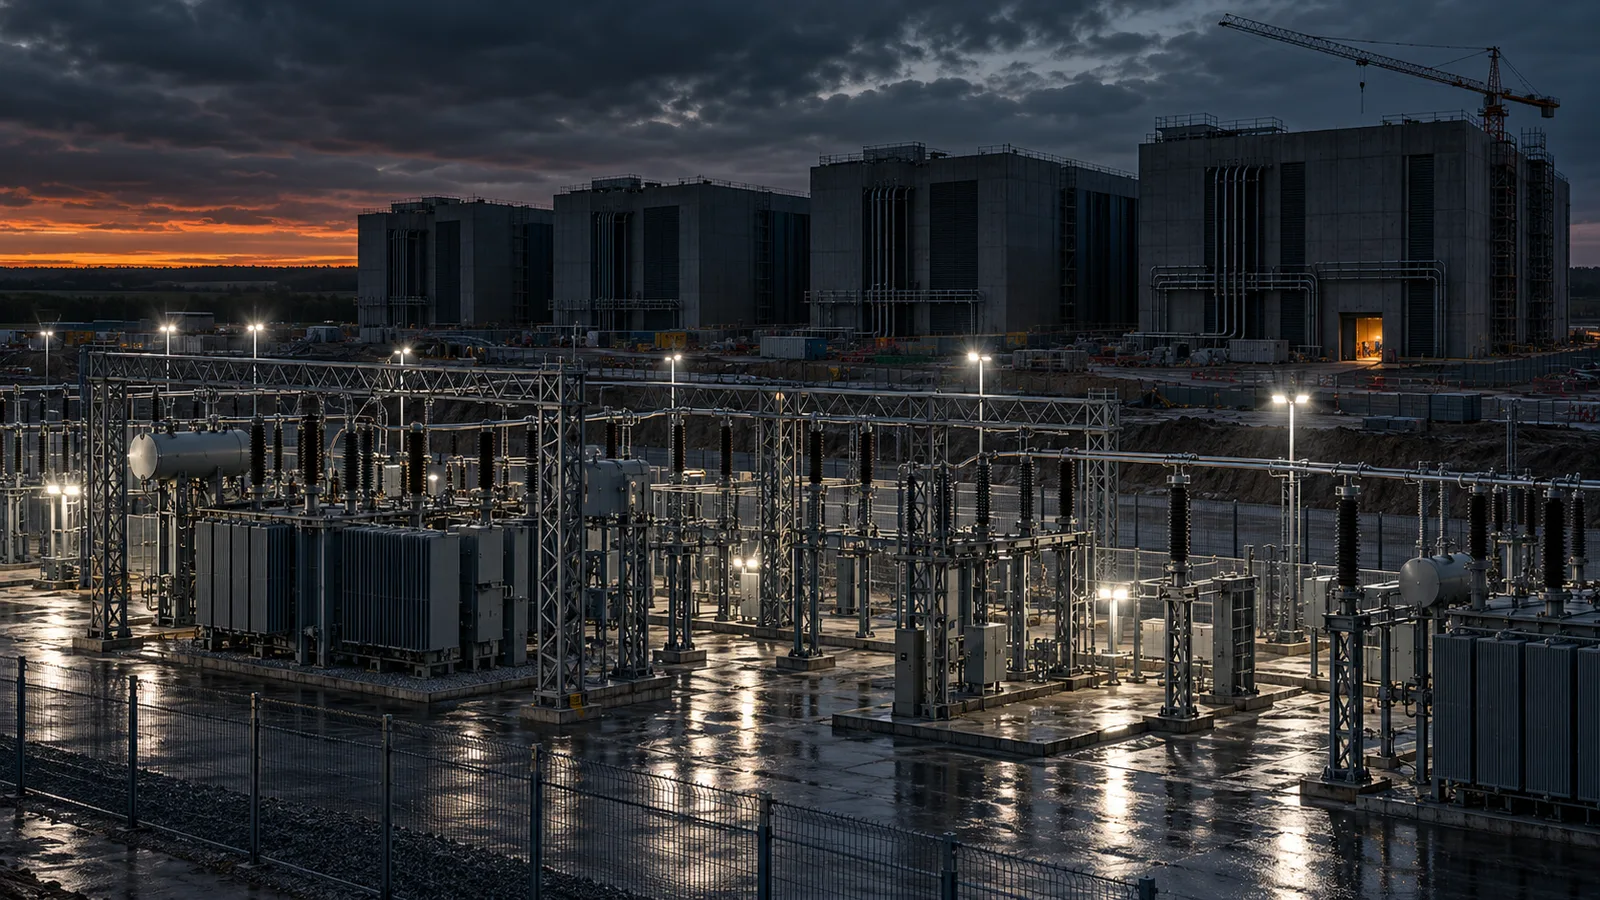
The relevant resource is therefore reliable power delivered where and when it is needed, with the infrastructure to distribute it and remove the resulting heat. A cheap electricity tariff does not guarantee that resource. Nor does an agreement to purchase annual renewable generation, on its own, establish firm local capacity in every operating hour.[7]
The shape of demand matters too. Some AI workloads produce rapid changes in power draw, so average consumption alone cannot establish whether the electrical system can support them. Power conversion, controls and, where appropriate, storage must help manage these changes while preserving the operating headroom required for reliability.[7]
02/ The units
What tokens per watt should actually mean
The first trap hides inside the phrase itself, so the units deserve care. A watt measures power: one joule of energy per second. A token count has no time dimension. The rigorous operational metric is therefore token throughput divided by power.
This equivalence holds when throughput and measured average power refer to the same observation period. For a variable workload, calculate total output divided by total energy over that period. Combining a peak throughput figure with a power reading from a different run produces a number without a defensible operating meaning.
For infrastructure planning, tokens per second per megawatt is often the most intuitive expression. For operating efficiency, tokens per kilowatt-hour is easier to connect to energy accounts. One kilowatt-hour contains 3.6 million joules, so the measures can be converted when their boundaries and periods match.
There is also a difference between measured power and provisioned power. Dividing throughput by the system’s rated or reserved capacity describes how productively that capacity is used. It does not establish how much energy the workload actually consumed.
That distinction is visible in MLPerf Endpoints’ developing v1.0 framework, which introduces throughput normalised by provisioned system power. Its documentation explicitly distinguishes the estimate from a meter reading, and parts of the power model were still marked as pending ratification in October 2026. This is evidence of the direction of benchmarking, with a clear limit on what the metric proves.[8][9]
The tokens-per-watt translator
Enter one measurement and read it in every unit that matters. The conversions are exact. Whether they mean anything depends on how the inputs were measured.
714,286 tokens/s ÷ 10,000,000 W = 0.0714 tokens/J
For the argument here, the relevant energy boundary is the operating facility supporting inference. A chip-level efficiency result is useful engineering evidence, but it is an incomplete answer to a facility-level investment question.
03/ Beyond GPU cost
GPU cost measures an input rather than business value
Every infrastructure pitch eventually arrives at a slide with one number on it, and the number is usually the price of a GPU hour. GPU cost is an essential part of the economics. It is also an insufficient proxy for either total production cost or the value of the result.
An owner operating an inference service must account for hardware depreciation or leasing, host systems, networking, storage, software, operations and maintenance. The facility brings further costs: electrical distribution, cooling infrastructure, electricity and any applicable capacity charges. Reliability reserves and idle equipment still incur costs even when they produce no output.
What the GPU price shows, and what the service costs
The visible number is real. It is just the smallest part of the bill.
Twelve lines of cost sit below the waterline.
A coherent model allocates these costs over a defined period and workload. It does not count both the original capital purchase and its depreciation as separate expenses for the same period. Equally, an API customer should not add an estimated operator electricity bill on top of an API price that already includes the provider’s operating costs.
Properly calculated, cost per token can already include power and cooling. The weakness lies in substituting GPU rental cost divided by an idealised throughput figure for a complete production model, then treating the result as the economics of an entire service.
Even complete cost per token answers a cost question. It does not tell us whether the output was correct, timely, adopted or valuable. A short answer that resolves a problem can be worth more than a long answer that creates another review cycle. An agent that completes a workflow in three model calls may deliver more value than one that requires thirty, even if the latter obtains cheaper individual tokens. You can test that claim with your own numbers in section 07.
Scarce power has an opportunity value
There is a further distinction between electricity expenditure and the opportunity value of scarce power capacity. Suppose accelerator depreciation remains the largest direct cost, but the facility has reached its grid limit. A more efficient serving system can still be commercially attractive because it creates room for additional profitable demand.
That opportunity is conditional. Additional capacity creates value only if there is demand, the service meets its requirements, and the extra contribution justifies the investment. Nevertheless, it explains why power can set a ceiling on revenue even when electricity is not the largest component of total cost of ownership.
04/ One boundary
Power and cooling must share one accounting boundary
Energy accounting has one rule that sounds too obvious to need saying, and it is broken constantly: count everything, and count it once. An AI accelerator operates inside a larger electrical and thermal system. Host processors, memory, storage and interconnects consume electricity. Power conversion introduces losses. Fans, pumps and cooling equipment support operation. All of these components affect the energy required to deliver a service.
A practical facility accounting identity is:
The categories must be mutually exclusive. Server fans or power conversion already included in the IT measurement should stay there; upstream losses and facility cooling should be added outside that boundary. Equipment should not disappear from the account merely because it sits outside the server chassis.
Four boundaries, four different answers
Choose a boundary. Everything lit sits inside it. Each one answers a different question, and none of them is wrong until it is used to answer someone else’s.
Facility
- Includes
- Usually quoted from
- Answers
- Leaves out
What one prompt really costs in energy
Google’s August 2025 production study demonstrates why this matters. For its representative median Gemini Apps text prompt, using May 2025 data, it reported approximately 0.24 Wh: 0.14 Wh for active accelerators, 0.06 Wh for active host CPU and DRAM, 0.02 Wh for provisioned idle machines, and 0.02 Wh for facility overhead. This is a product-specific estimate under Google’s methodology, not a universal energy figure for an AI request. Its median is derived from model-level averages and prompt volumes, rather than individual request metering. The boundary excludes training, data storage and end-user devices. The relevant lesson is the material difference between accelerator energy and the broader serving footprint.[10]
One prompt, two boundaries
Google’s median Gemini Apps text prompt, May 2025 data. Narrow the boundary to the accelerators and watch 42% of the energy disappear from view.
| Active accelerators | 0.14 Wh |
| Active host CPU and DRAM | 0.06 Wh |
| Provisioned idle machines | 0.02 Wh |
| Facility overhead | 0.02 Wh |
Set that beside the figure Sam Altman offered in June 2025, that the average ChatGPT query uses “about 0.34 watt-hours”.[11] His post gave no measurement approach and no definition of a query, so the two numbers cannot be compared, and that is exactly the point. Without a stated boundary and method, a per-query energy figure is a talking point. With them, it becomes a measurement that somebody else can check.
Heat is not a second electricity bill
Cooling introduces a common accounting mistake. Nearly all electricity consumed by IT equipment ultimately becomes heat. A 1 MW IT load therefore creates approximately 1 MW of thermal load to remove. It does not follow that cooling requires another 1 MW of electricity. The cooling plant consumes additional electrical energy to move and reject that heat, with the amount depending on its design and operating conditions.
The correct calculation adds the electricity consumed by the cooling system. It does not add the heat load itself as if thermal megawatts were another electricity purchase.
Thermal megawatts are not purchased megawatts
Set the IT load and how much electricity the cooling plant needs per unit of heat it removes. Compare the honest bill with the tempting mistake.
Power usage effectiveness, or PUE, provides a useful infrastructure ratio. In its conventional annual form, it divides total facility energy by IT equipment energy. At a PUE of 1.20, each 1 kWh consumed by IT corresponds to 1.20 kWh at the facility boundary. The extra 0.20 kWh includes the relevant non-IT overhead, not necessarily cooling alone. The US Department of Energy explicitly cautions that PUE measures supporting infrastructure efficiency rather than overall computational efficiency.[12]
If an applicable PUE has already been used to translate whole-IT energy into facility energy, cooling must not be added again. If electricity is already measured at the whole-facility boundary, multiplying it by PUE would double-count overhead.
Spot the double count
Four statements from imaginary business cases. Which ones keep the boundary honest?
“We metered 12 GWh at the facility boundary last year, then multiplied it by our PUE of 1.3 to get facility energy.”
“Our 2 MW IT load produces about 2 MW of heat, so we budgeted another 2 MW of electricity for cooling.”
“We converted whole-IT energy into facility energy with the applicable PUE, and did not add cooling separately.”
“Server fans are in our IT measurement, and we also listed them under facility cooling.”
0 of 4 answered
This boundary discipline becomes increasingly important when comparing air and liquid cooling. Moving a cooling function from server fans to equipment elsewhere in the facility can change the location of the measured consumption. A credible efficiency improvement must survive the move to a common measurement boundary.
05/ Cooling
Better cooling changes the productive use of a power allocation
Liquid cooling has become the data centre industry’s favourite photograph: braided hoses, glowing manifolds, a rack that looks as if it needs a plumber more than an electrician. The physics behind the photograph is less glamorous and more useful. Direct liquid cooling captures heat close to its source and transports it to a heat exchanger and the wider heat-rejection system. Depending on the design, it can reduce fan requirements and support warmer coolant temperatures, which may enable more efficient heat rejection. Some systems still require air cooling for components whose heat is not captured by the liquid loop.[12]
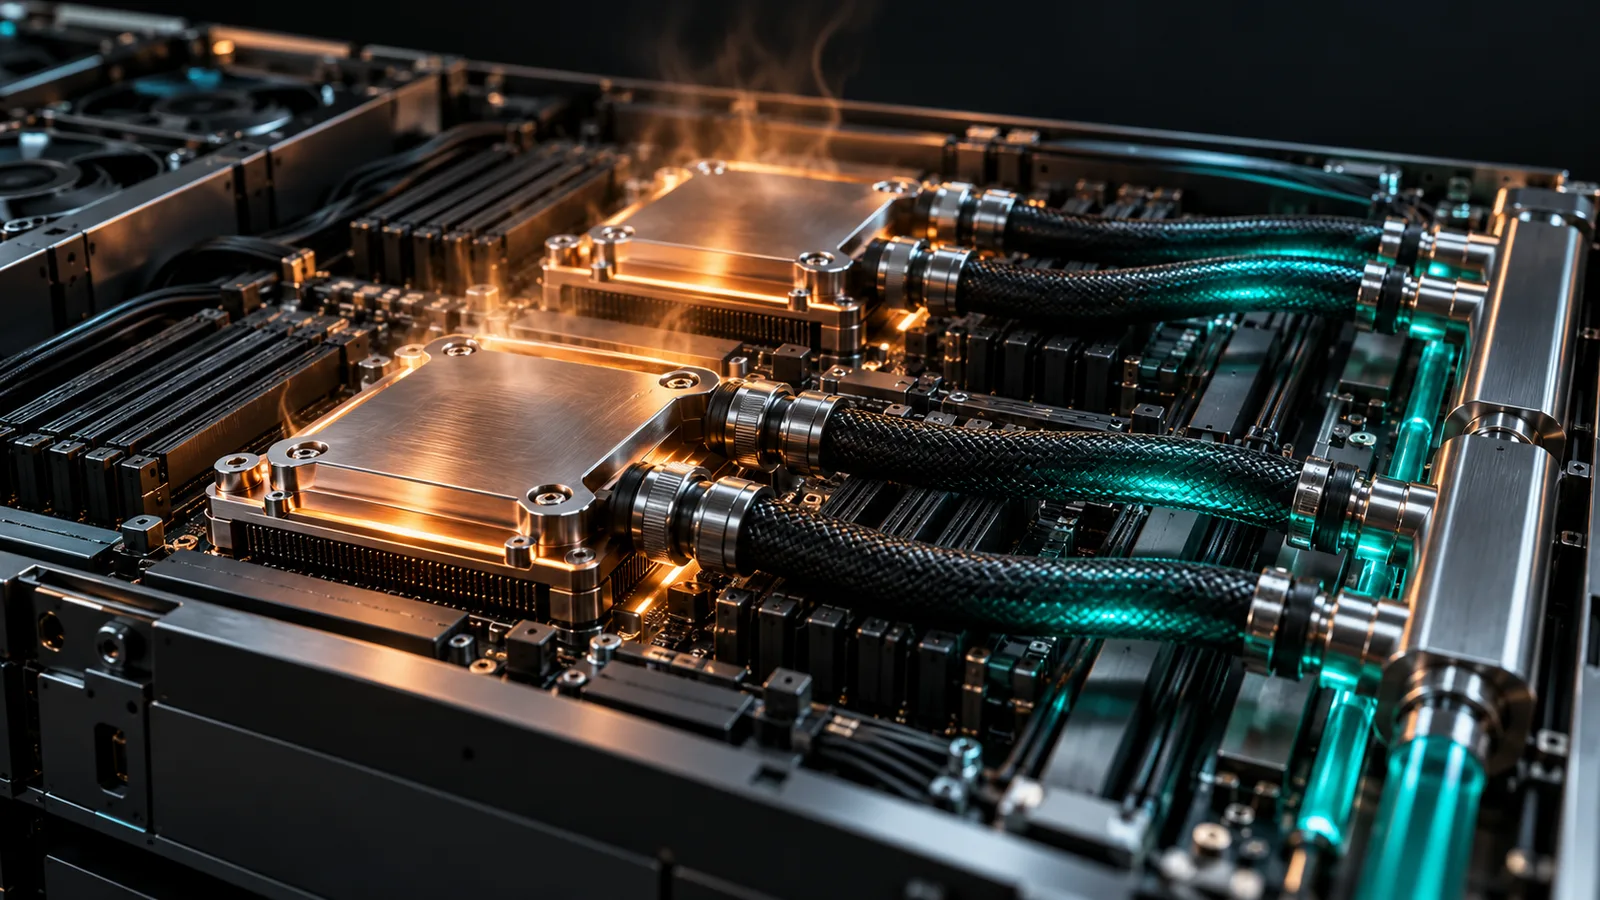
The facility must still reject the heat. A closed loop at the rack does not establish that the entire site consumes no water. The US Department of Energy describes arrangements where the internal liquid loop connects to systems that ultimately use an evaporative cooling tower. It also documents hybrid approaches whose operation changes with outdoor conditions.[13]
| Question | Air cooling | Direct liquid cooling |
|---|---|---|
| Where heat is captured | By air moved through the server | Close to the source, in a liquid loop to a heat exchanger |
| Server fans | Carry the whole heat load | Can be reduced, depending on the design |
| Coolant temperature | Set by the air path and room conditions | Can run warmer, which may allow more efficient heat rejection |
| Parts the loop misses | Not applicable | Some components may still need air |
| Facility heat rejection | Required | Still required, and a closed rack loop does not mean the site uses no water |
| Where the energy shows up | Mostly fans and room cooling | Partly moves to pumps and facility plant, so compare at a common boundary |
This makes cooling an architecture decision with consequences for electricity consumption, water use, density, operating reliability and capital cost. The appropriate design depends on climate, component temperature limits, available water, the building and its expected workload. If you want to see what rack-scale liquid cooling involves in practice, our field guide to NVIDIA’s Vera Rubin NVL72 walks through one complete rack.
The PUE paradox
PUE is valuable within that decision, but it cannot be the only objective. Consider an illustrative facility using 80 units of IT energy and 20 units of overhead. Its PUE is 1.25. If improved software halves the IT energy required for the same work while overhead remains at 20, total energy falls from 100 units to 60. Yet PUE becomes 1.50.
The ratio that punishes good software
Same work throughout. Improve the software and watch total energy fall while PUE gets worse.
Move the slider to improve the software.
The facility has become substantially more efficient at doing the work, even though its PUE has worsened. This arithmetic explains why infrastructure ratios must be paired with a measure of productive output.
For consistent measurement periods and boundaries, facility token efficiency equals IT token efficiency divided by the applicable facility-to-IT energy ratio. The objective is to improve the complete result. Optimising either the servers or the cooling plant in isolation can conceal costs elsewhere in the system.
06/ The 10 MW lab
Two AI facilities under the same 10 MW limit
Now put the pieces together and run the experiment that most business cases skip. Consider two hypothetical designs serving the same workload at the same output quality and latency requirements. Both have a 10 MW limit on total facility draw. Assume sufficient hardware budget, rack space, network capacity and demand to use the resulting capacity. The efficiency and PUE figures describe the same representative operating conditions; they are not vendor measurements.
| Metric | Design A | Design B |
|---|---|---|
| Total facility power limit | 10 MW | 10 MW |
| IT efficiency | 100 tokens/s per IT kW | 120 tokens/s per IT kW |
| PUE at the assumed operating point | 1.40 | 1.15 |
| IT power available within the limit | 7.143 MW | 8.696 MW |
| Output throughput at the facility limit | 714,286 tokens/s | 1,043,478 tokens/s |
| Output per facility kWh | 257,143 tokens | 375,652 tokens |
| Facility energy per million output tokens | 3.89 kWh | 2.66 kWh |
The calculation is straightforward. Divide the facility power limit by PUE to obtain the IT power available, then multiply by the IT throughput per kilowatt.
The 10 MW lab
Two hypothetical designs, one grid allocation. Move any slider and the arithmetic follows. Start from the article’s example, or isolate the software effect and the cooling effect.
- Tokens per facility kWh
- 257,143
- kWh per million tokens
- 3.89
- Facility power drawn
- 10.00 MW
- Tokens per facility kWh
- 375,652
- kWh per million tokens
- 2.66
- Facility power drawn
- 10.00 MW
more output from the same 10 MW.
Open the commercial lens
What the same grid allocation is worth. Every price here is hypothetical, so change them.
| Per year | Design A | Design B |
|---|---|---|
| Output sold at this utilisation | ||
| Revenue capacity | ||
| Electricity cost per million tokens | ||
| Electricity as a share of the price |
If demand remains at Design A’s original throughput, and Design B maintains the assumed IT efficiency and PUE at that load, the same simplified model gives it a facility requirement of approximately 6.845 MW, a reduction of 31.5%. These are different operating choices: use the efficiency gain to expand production, or use it to reduce energy for the original workload. Running both designs at 10 MW produces no absolute electricity saving over the same period; Design B produces more output.
None of this proves that B has the lowest total cost. It could require more expensive hardware or a costly cooling retrofit. Actual design also needs peak-load, redundancy and hot-weather analysis; an annual PUE is not automatically the right ratio for the hottest operating hour.
The example establishes a narrower and useful point. Power and cooling efficiency can change the amount of AI service an existing electrical allocation can support. That effect belongs in the business case alongside equipment cost. Our AI factory blueprint approaches the same decision from the other side, matching the platform to the workload before the megawatts are committed.
07/ Useful work
More tokens are useful only when the work is useful
There is an easy way to win a tokens-per-watt contest: talk more. Token throughput can be improved in ways that do not improve an application. Longer responses produce more tokens. Unnecessary reasoning produces more tokens. Repeated attempts produce more tokens. A benchmark that rewards all of them indiscriminately can report progress while the user experiences a slower or less reliable service.
Tokens are also model-specific units of representation. Different tokenisers can represent the same text using different counts. Input processing, generated output and cached input do not represent identical computational work. Cross-model comparisons therefore need a defined counting method and a matched workload; raw token totals are not a universal unit of intelligence.
Same sentence, different token counts
Two made-up tokenisers split identical text. Neither is wrong. They simply are not the same unit.
The same 55 characters. Tokeniser B counts 55% more tokens, so a price per million tokens, or a tokens-per-joule figure, means something different for each.
For serving infrastructure, the numerator should be delivered output under an explicit workload, quality threshold and latency requirement. Internal reasoning and rejected speculative drafts should not be relabelled as useful customer output, although the energy required to produce them remains in the denominator. If a benchmark counts a different category of tokens, it should say so.
Latency matters because a response that arrives too late may have little practical value. DistServe formalises a related concept, goodput, by evaluating the request rate that can be served within time-to-first-token and time-per-output-token constraints. That is a serving-performance measure. Extending the principle to semantic correctness and business acceptance is an additional application-level requirement.[14]
From tokens generated to work accepted
Energy is spent on every token. Value is earned only on output that arrives in time and is accepted.
Successful tasks per kilowatt-hour
For business decisions, I would put successful tasks per facility kilowatt-hour beside total cost per successful task. Success needs an explicit definition: a document processed with verified fields, a code change that passes the required checks and is accepted, or a workflow completed without an avoidable repeat cycle.
These measures still require comparable task categories. An easy extraction and a complex engineering investigation should not count as interchangeable units merely because both are labelled successful.
The energy account should include failures, retries, verification, retrieval and tool execution where they belong to the workflow. The numerator counts the accepted result; the denominator records the resources used to reach it. For costs, include the relevant human review and rework as well.
Cheap tokens, expensive outcomes
Two hypothetical agents attempt the same task. Edit any input. The lesson is which metric you optimise, not these particular defaults.
| Per task attempt | Agent X larger model | Agent Y smaller model |
|---|---|---|
| Model calls | ||
| Tokens per call | ||
| Price per million tokens ($) | ||
| Facility kWh per million tokens | ||
| Attempts that succeed (%) | ||
| Human review per attempt (minutes) | ||
| Results | ||
| Token cost per attempt | ||
| Total cost per successful task | ||
| Energy per successful task | ||
| Successful tasks per kWh | ||
A larger model may then justify higher energy per request if it completes the task with fewer attempts or less supervision. A smaller model may be the better choice when it meets the same acceptance criteria. The right answer comes from the complete workflow, not model size or token price in isolation. It is the same logic we applied to contact centres in Agentic Customer Experience, where the unit that matters is a verified resolution rather than a contained contact.
08/ Serving
Serving architecture determines what a joule can produce
Two systems built from the same hardware can produce very different amounts of work per joule, and most of the difference lives in software and scheduling. Inference efficiency depends on how the model uses the hardware. Increasing nominal compute capacity does not guarantee a proportional increase in useful output.
Prompt processing, often called prefill, can perform substantial parallel computation. Generating output, or decoding, produces successive tokens while repeatedly accessing model state and context. At lower concurrency, memory movement can be a stronger limit than arithmetic throughput. Splitwise explores this difference and shows why the phases can benefit from different resource allocations. Separating them also introduces state-transfer and networking requirements, so the complete system must be evaluated.[15]
Prefill and decode are different jobs
Prefill reads the whole prompt at once and leans on arithmetic. Decode writes one token per step and leans on memory. Switch the serving layout and follow the state.
Swipe sideways to follow the whole pipeline.
Batching can spread model access and other work across multiple requests, improving throughput and often energy efficiency. But larger batches can increase response latency. The best operating point for overnight document processing can therefore be unsuitable for a live assistant.
Long contexts and extended reasoning create a further interaction. They can increase the amount of stored attention state, commonly called the KV cache, and reduce the number of requests that fit in memory simultaneously. ML.ENERGY’s January 2026 analysis documents this interaction between response length, memory pressure and energy per token. It also shows that lower-precision execution does not automatically reduce energy in every configuration; conversion overhead can outweigh benefits at small batch sizes. These are GPU-level findings, which still need translation to a facility boundary.[16]
Batch size, latency and the memory wall
A stylised model, built for intuition rather than measurement. Bigger batches share the fixed cost of each step across more requests, until the latency target or the KV cache says stop.
Speculative decoding has similar conditions. A smaller model proposes tokens for a larger model to verify. It can reduce the expensive model’s sequential work, but rejected proposals and verification still consume energy. Research by Fernandez and colleagues found that its energy benefit changed with batch size and could reverse at high batching in the configurations studied. Their measurement focuses on GPU energy, so it does not establish a universal facility-level saving.[17]
The practical response is to benchmark the intended operating conditions. Test context management, caching, model routing, numerical precision, batching and parallelism against the actual arrival pattern and acceptance criteria. Cache hits can avoid computation, but a reported saving must include the cache infrastructure and distinguish reused results from newly generated output. Routing also has an overhead that must be justified by the work it avoids.
An accelerator’s rated wattage alone is equally inadequate. A device that draws more power can still consume less energy per completed task if the whole system completes proportionally more work. Conversely, a low-power device can be a poor choice if it requires too many replicas or cannot meet the latency requirement.
These are reasons to evaluate accelerators, memory, interconnects, serving software and cooling as a system. The business value of a hardware feature depends on whether the intended workload can use it. For the mechanics of prefill, decode and memory in more depth, our guide to how local LLMs run walks a single prompt through all eight stages.
09/ Measurement
Energy efficiency needs a disciplined measurement method
A benchmark without its conditions is an advertisement with a decimal point. A useful comparison should disclose the model and software versions, tokeniser, precision, input and output length distributions, cache behaviour, concurrency and demand pattern. It should state the quality threshold and latency targets, including the proportion of requests that must meet them.
Grade a tokens-per-watt claim
Tick what the vendor or provider actually disclosed. The score is a reading aid, not a standard.
0 of 13 disclosed. Treat the number as marketing until the conditions arrive.
The energy measurement needs an equally explicit boundary. Chip telemetry, server wall power, rack power and whole-facility energy are different quantities. They answer different engineering questions and should not be presented as interchangeable.
| Quantity | What it answers | What it cannot answer |
|---|---|---|
| Chip telemetry | How efficiently the accelerator runs this workload | What the service costs in energy |
| Server wall power | How efficient the node is, host and fans included | Shared networking and storage, cooling plant, upstream losses |
| Rack power | What the IT estate draws per unit of output | Facility overhead and upstream losses |
| Whole-facility energy | What the service costs in energy at the grid boundary | Lifecycle impacts such as training, manufacture and construction |
MLPerf Power illustrates both progress and the remaining limitation. It coordinates power and performance measurement and seeks to capture the relevant system, rather than the accelerator alone. Its published methodology also identifies unresolved allocation for external cooling and separately powered storage. A system power benchmark therefore needs careful inspection before it is described as a complete facility-energy result.[18]
Production accounting should cover quiet periods as well as busy ones. Spare capacity can be necessary to absorb demand peaks, satisfy latency targets and maintain service during failures. Its energy is part of operating the service. An incremental measurement of one additional request can be useful for scheduling, but it is a different quantity from allocating total fleet energy across all delivered work.
For mixed facilities, shared infrastructure requires a documented allocation method. Measurements should reconcile to the broader energy account, and sampling uncertainty should be visible. Long enough observation periods are needed to capture workload variation; cooling assumptions should reflect seasonal conditions where annual energy is being estimated.
I would expect an AI infrastructure assessment to report the following measures together:
| Measure | What it answers |
|---|---|
| Output tokens per measured facility kWh | How efficiently does the system serve a defined token workload? |
| Qualified throughput per provisioned facility MW | How productively can allocated capacity serve the required workload? |
| Successful comparable tasks per kWh | How much accepted work does the energy deliver? |
| Total cost per successful task | What does delivering that work actually cost? |
| Quality, latency and reliability attainment | Does the service meet the conditions that make its output usable? |
The first two measures are useful for infrastructure decisions. The next two connect them to application economics. The final measure prevents an apparent efficiency gain from being purchased through degraded service.
10/ Environment
Energy use is part of a wider environmental account
Efficiency is a ratio. The atmosphere sees a total, and it cares which grid the total came from. Lower operational energy per task is valuable, but it does not by itself prove lower carbon emissions or lower water consumption. Electricity sources, cooling design and location also matter. A task running on a different grid can have a different emissions footprint even if its measured energy consumption is unchanged.
Same energy, different grid
Emissions per million output tokens depend on the energy per token and on the grid that supplied it. Put the two designs from the 10 MW lab on different grids.
Water needs its own boundary. Site water usage effectiveness relates water consumption to IT electricity use, while a wider assessment can include water associated with electricity generation. Cooling choices can involve trade-offs: the Department of Energy notes, for example, that water-recovery treatment can reduce freshwater demand while increasing electricity use.[13]
Operational inference efficiency should also be distinguished from lifecycle impact. Model training, fine-tuning, development experiments, hardware manufacture and facility construction do not automatically appear in a runtime token metric. A broader assessment needs an explicit allocation method and consistent boundaries. Benefits from heat reuse or avoided activity elsewhere should be reported separately and supported by evidence, rather than assumed to cancel the original consumption.
This distinction keeps the central argument precise. Tokens per joule evaluates a conversion efficiency. Successful tasks per kilowatt-hour evaluates productive energy use. Neither is, on its own, a complete environmental assessment.
11/ Rebound
Better efficiency can coexist with rising electricity demand
In The Coal Question, published in 1865, the economist William Stanley Jevons observed that England’s coal consumption had soared after James Watt’s steam engine greatly improved on Thomas Newcomen’s earlier design.[19] His conclusion has outlived the coal age: “It is wholly a confusion of ideas to suppose that the economical use of fuel is equivalent to a diminished consumption.”[20]
Efficiency gains do not guarantee that total consumption falls. The arithmetic is simple: total task volume multiplied by average energy per task determines aggregate energy for a defined workload mix.
If energy per task halves while task volume triples, total energy rises by 50%. More affordable or more capable services can encourage additional use, while new applications can change the type and difficulty of the work being performed.
The rebound calculator
Total energy is task volume multiplied by energy per task, so the area of each rectangle is the electricity bill.
The IEA’s 2026 analysis describes AI electricity demand as the combined result of improving efficiency, expanding adoption and changing capabilities, including more demanding reasoning and agentic applications. These forces can operate simultaneously.[3]
That does not weaken the case for efficiency. It means efficiency should be assessed against a clear alternative. Without the improvement, serving the expanded workload would require still more energy. Within a constrained site, greater efficiency also gives the operator more choices about which work to accept and when to run it.
12/ Business case
The AI business case needs an electrical and thermal operating model
Most AI business cases are written in the order the money is spent: chips first, building second, power last. The physics would like the order reversed. For a provider building an AI service, power and cooling should enter the architecture and commercial model before equipment commitments are finalised. The assessment should specify the capacity that can actually be energised, the date it becomes available, the density and thermal limits, and the operating headroom required for reliable service.
It should then model representative demand, including idle periods and peak arrivals, and benchmark the configurations capable of meeting that demand. A proposal should explain how much accepted work fits within the available power envelope, how cooling affects that capacity, and what the full service costs at realistic utilisation.
- Energisable capacity and dateHow many megawatts can actually be energised, and from when.
- Density and thermal limitsWhat the building can distribute and cool, rack by rack.
- Operating headroomWhat must stay in reserve for reliability, failover and the hottest hours.
- Representative demandIdle periods, peak arrivals and the real request mix.
- Configurations that meet itBenchmarked at the intended operating point, not at the peak.
- Accepted work and full costHow much accepted work fits inside the power envelope, and what the whole service costs at realistic utilisation.
For an enterprise consuming APIs, the operational details are less directly controllable, but the principle still applies. Evaluate total cost per successful workflow, including retries and review. Where energy or location is material to the decision, ask providers for a clearly bounded methodology and relevant evidence. A low token price alone does not establish service resilience, future capacity or an efficient application design.
Flexible workloads can offer another route to better use of existing infrastructure. Some batch processing can be scheduled around grid or cooling constraints; interactive services have less freedom. The value of that flexibility must be weighed against deadlines, data-location requirements and the cost of moving or repeating work.
Move the work, not the grid
Interactive services run when people need them. Batch work can often wait. Shift the flexible jobs out of the constrained evening hours.
The next serious AI business case should show what each available megawatt can deliver, how the resulting heat will be managed, and how that output becomes accepted work. Put that evidence beside total cost per successful outcome, and the economics become much closer to the service the organisation is actually trying to build.
13/ Go-to-market
Selling the megawatt: tokenomics as a go-to-market discipline
Everything so far has been about measuring honestly. The commercial question is harder: how does a provider turn that discipline into something a customer will choose, and pay more for? This is where many AI clouds still market themselves the way they did when the GPU was the scarce thing, and it is where the next generation of neoclouds will separate itself from the last.
The first salesman of efficiency
On 22 March 1776, James Boswell toured Matthew Boulton’s Soho Manufactory in Birmingham and recorded the owner’s pitch in a single line: “I sell here, Sir, what all the world desires to have: POWER.”[21] Boulton’s partner was James Watt, and the product was Watt’s engine, which burned far less coal than the atmospheric engines then pumping water out of Britain’s mines.
What made the partnership remarkable was not only the engine. It was the way they sold it. Boulton and Watt priced their pumping engines on a royalty of one-third of the saving in coal, compared with the atmospheric engine being replaced. For the rotative engines that drove machinery, the premium was likewise based on the saving against the power being replaced, such as horses.[22] The unit Watt adopted for that comparison, horsepower, has outlived both men.[23] They even metered the work. A counter fixed on the engine beam registered its strokes, because payment in many cases was made by the pumping work performed, and mine owners disputed the readings because the counter counted the short strokes of the engine equally with the complete ones.[24]

Read that as a go-to-market plan and it is startlingly modern. Invent a unit the customer already understands. Price on the value the efficiency creates rather than the cost of the machine. Meter what you charge for. And expect the customer to audit the strokes, because the moment you charge for output, every short stroke counted as a complete one becomes a dispute. Two and a half centuries later, that is exactly where tokens per watt sits.
From horsepower to tokens per watt
The yardstick has always been part of the sales pitch. Select a moment.
James Boswell records Matthew Boulton at the Soho Manufactory: “I sell here, Sir, what all the world desires to have: POWER.” The first efficiency pitch is a pitch about power.
Watt adopts horsepower to compare his engines with draft horses, Boulton and Watt charge on the coal or the horses saved, and a counter on the engine beam registers the strokes that customers pay for.
In The Coal Question, William Stanley Jevons argues that the economical use of fuel is not the same thing as diminished consumption. Efficiency and demand can rise together.
At GTC, Jensen Huang shows AI factory curves with token output normalised to a power budget, and updates his catchphrase to “the more you buy, the more you make”.
Sam Altman puts the average ChatGPT query at about 0.34 watt-hours, in a blog post with no stated methodology or definition of a query.
Google publishes about 0.24 Wh for a median Gemini Apps text prompt, with the boundary, the components and the exclusions stated.
Satya Nadella says Microsoft’s problem is not a supply of chips but “warm shells to plug into”. The scarcity has moved to the megawatt.
The International Energy Agency estimates that data centres used 485 TWh in 2025, with consumption at AI-focused sites up 50% in a single year.
Ofgem counts about 73 GW of contracted data-centre demand in Great Britain’s June 2025 queue, and warns that speculative projects distort the planning signal.
MLPerf Endpoints’ developing rules normalise throughput by provisioned system power and say plainly that the estimate is not a meter reading. The industry is learning to label its watts.
Why the GPU-hour pitch is running out of road
For most of the AI build-out, an AI cloud’s price list was a list of GPU hours. It is the natural unit for a scarce chip: the customer rents time on the thing everybody wants. But a GPU hour leaves every hard question with the buyer. Is the hardware busy? Is the serving software efficient? Does the output arrive in time, and is it any good? The provider is paid either way. For a startup still deciding whether to rent or own its first GPU, our field guide to NVIDIA for founders makes the case for renting until the utilisation math says otherwise.
Even the company that sells the chips has moved on. NVIDIA’s tokenomics guide describes FLOPS per dollar and cost per GPU-hour as “the wrong metrics for evaluating AI infrastructure”, and argues that “throughput per MW impacts your revenue and cost per token determines profitability per interaction”.[2] At GTC in March 2025, Jensen Huang showed AI factory curves normalised to a power budget and updated his old catchphrase, “the more you buy, the more you save”, to “the more you buy, the more you make”.[25] When the vendor’s own pitch moves from the price of the machine to the revenue of the megawatt, the clouds reselling that machine should take the hint.
The strategic logic is simple. A GPU hour is an input that any competitor with the same chip can match the moment supply loosens. Accepted work per energised megawatt is the output of a specific combination of power, cooling, software and operations, and that combination is much harder to copy. Differentiation lives where the physics and the engineering meet, so that is where the pitch should live too.
Climb the value ladder
Tokenomics gives a provider five units it can sell, and the choice is strategic rather than cosmetic. Each rung up the ladder moves risk from the customer to the provider, which is why each rung can support a better margin, and why each one demands more proof.
The tokenomics value ladder
Choose a rung to see what you sell, who carries the risk and what you will have to prove.
- You sell
- The customer still carries
- You must prove
- Watch out for
Sell energised megawatts, not paper ones
Capital markets have already learned to read megawatts with care. When we looked at whether Nebius could become a trillion-dollar AI hyperscaler, its contracted power stood at more than 3.5 GW, while expected connected power by the end of 2026 was 800 MW to 1 GW.[26] The gap is not a scandal. It is the normal shape of a build-out, and Ofgem’s concern about speculative developments is a reminder that part of any queue may turn out to be air.[6] But it does mean that “we have a gigawatt” is the weakest sentence an AI cloud can say to a customer. The strong sentence is dated and specific: this many megawatts energised, at this density, with this cooling, available from this date, delivering this much qualified throughput.
The megawatt funnel
Every stage between a signed power contract and billable work carries its own risk. The first two figures are Nebius’s own. The rest are the numbers a buyer should ask for.
One metric, six audiences
The same physics has to be translated differently for each person at the table. A message that wins the platform engineer will bore the CFO, and a carbon figure that satisfies the sustainability lead means nothing to a developer worrying about time to first token. Here is how I would brief a sales team.
Who is across the table?
The physics stays the same. The sentence that lands does not.
What will this cost per unit of work, and how predictable is that cost as volume grows?
Total cost per successful task at forecast utilisation, with retries and review included.
A cost model they can audit, its sensitivity to volume and price, and service credits that bite when targets are missed.
Paying for capacity that sits idle, or for output that has to be done twice.
“At your forecast volume, an accepted document costs X, including retries and review. Here is the model, and here is what happens to that number if volume doubles.”
“Our GPUs are 30% cheaper per hour.” An input price, with no output attached.
Will it meet our latency and reliability targets on our real traffic, and can it grow with us next year?
Goodput: requests served inside time-to-first-token and time-per-output-token targets, per provisioned megawatt.
A replay of their own traffic, with the full disclosure set: model, precision, lengths, concurrency and cache behaviour.
A benchmark that looked wonderful at a batch size their users would never tolerate.
“On a replay of your traffic, 99% of requests met your first-token target at this concurrency. This is the headroom we hold for failover, and this is the date the next block of energised capacity comes online.”
“Peak tokens per second”, with no latency, concurrency or boundary attached.
How fast is it, how reliable, and what does one request cost my product?
Time to first token, tokens per second per user, price per million output tokens, and cached input priced separately.
Public latency percentiles by region, transparent rate limits and an honest status history.
Latency spikes at their busiest hour, and bills they cannot predict.
“In your region, median time to first token is X ms and P95 is Y ms, and cached input is priced separately, so you can see exactly what reuse saves you.”
One blended token price that hides input, cached and output tokens.
What energy, carbon and water sit behind our AI usage, and can we report it?
Facility kWh per million output tokens, grid emissions per kWh on a stated basis, and site water use.
A bounded methodology, a measurement period that includes the seasons, and reconciliation to metered energy.
A green claim that will not survive the auditor.
“Here is the facility-boundary energy for your workload last quarter, the grid emissions factor for the hours it ran, and the site’s water figure, with training and hardware manufacture reported separately.”
“Carbon-neutral AI”, resting on annual certificates alone.
How do we compare providers fairly?
Matched-workload results and cost per successful task, plus how complete each provider’s disclosure is.
The same evaluation pack run on every shortlisted provider, reported in one standard format.
Comparing list prices across models whose tokens are not the same unit.
“Run your evaluation pack on our platform and on the others. We will publish the boundary and conditions next to our result, and you should expect the same from everyone else.”
“The lowest price per million tokens on the market.”
How much of the announced capacity is earning, and when does the rest arrive?
Contracted, connected, energised and billable megawatts, revenue per energised megawatt, and utilisation.
Dated energisation milestones, customer acceptance and a utilisation history.
Capital committed to megawatts that never reach a customer.
“Of our contracted megawatts, this share is energised, this share is billable, and here is the dated schedule for the rest.”
Headline contracted gigawatts presented as if they were operating capacity.
Publish the label, not the brochure
Packaged food solved a similar problem with a standard nutrition panel. Whatever the front of the box claims, the back lets a shopper compare two products on the same terms. AI infrastructure needs its own panel, and the measurement method in this article is most of it. Here is the kind of label a provider could publish for each service tier.
Brochure or label?
The same imaginary service, described two ways. Which would you rather put in front of a procurement committee?
- Industry-leading price per token**
- 100% renewable AI***
- Gigawatts of capacity
* Versus an unnamed previous generation, internal testing, configuration not disclosed. ** Model, tokeniser and latency not specified. *** Annual certificates. Capacity contracted; energisation dates not given.
Token Facts
Example service: open-weight chat model, interactive tier. Measured over 90 days, including the summer peak.
Excluded: training, fine-tuning, hardware manufacture and construction. Heat reuse reported separately. Example label with hypothetical values; the efficiency rows carry Design B from this article’s 10 MW model.
Claims that should send a buyer looking for the asterisk
Some claims deserve a raised eyebrow on sight. None of them is necessarily false. Each is incomplete in a way that matters, and each has a question that completes it. Turn the cards over.
Package the offer the way the physics works
If the measurement is honest, the packaging can follow the physics. Different buyers need different guarantees, and each offer below puts a different metric on the invoice and a different risk on the provider’s side of the table.
| Offer | Built for | What is guaranteed | Metric on the invoice | Risk the provider holds |
|---|---|---|---|---|
| Reserved energised capacity | Model builders and large platforms | Megawatts energised by a date, at a stated density, with headroom | Per MW-month, or GPU hours inside an energised block | Delivery date, power and cooling availability |
| Goodput tier | Product teams with live users | Latency percentiles and availability | Per million output tokens served inside the targets, with credits | Serving efficiency, utilisation and latency |
| Flexible batch tier | Document, data and evaluation pipelines | A completion window rather than a latency | Per million tokens, at a discount | Scheduling around grid and cooling constraints |
| Outcome-linked pilot | Enterprises with a defined unit of work | Cost per successful task inside an agreed band | Per accepted task, or a share of the measured saving | Model choice, retries and efficiency, against a jointly defined success |
| Energy-transparent reporting | Regulated and reporting-heavy buyers | Bounded energy, carbon and water per workload | An add-on, or included in the tier | Measurement quality and audit |
The pattern is the Boulton and Watt one in modern dress: the closer the invoice metric gets to the customer’s own unit of value, the more risk the provider holds, and the more evidence it must be able to show. Outcome-linked pricing is not where a new provider should start. It is where a provider with years of metered, disclosed, comparable data can eventually go.
A message house for a new-generation neocloud
For the marketing team, the whole argument compresses into one positioning line held up by three pillars, each with proof points a sceptical buyer can check.
- Dated megawatts, not contracted ones
- Density and cooling ready for current racks
- Headroom held for failover and hot days
- Qualified throughput per MW at your latency
- Cost per successful task at realistic utilisation
- Efficiency gains passed on as capacity
- Facility-boundary metering
- Published benchmark conditions
- Energy, carbon and water per workload
Start every sales conversation with three questions
Finally, the conversation itself should start somewhere other than the price list. Three questions turn a GPU negotiation into a tokenomics one.
A verified document, a resolved ticket, an accepted code change. If the customer cannot name it, the first deliverable is helping them define it.
Latency targets, quality thresholds, data-location rules, and the share of requests that must meet them.
Power, location, carbon, budget or timeline. The binding constraint decides which rung of the ladder the deal belongs on.
Then translate the answers into megawatts, and the megawatts into money: how many accepted units each energised megawatt delivers, at what total cost, from which date. A provider that can answer that sentence with evidence is no longer selling GPUs. It is selling what Boulton sold, and measuring it better than his counter did.
14/ Verdict
The verdict: count the complete strokes
James Watt’s counter was a clever piece of engineering with one flaw that his customers spotted at once: it could not tell a short stroke from a complete one. Tokens per watt has the same flaw if we let it. Count every token, from every reasoning loop and every retry, against the chip’s power alone, and the metric will flatter almost any system. Count delivered output, inside the facility boundary, within the latency and quality the customer asked for, and it becomes one of the most useful numbers in an AI business case.
So my position is this. Tokens per watt deserves its place beside cost per token, because power has become the ceiling on how much AI a provider can build and sell, and a joule spent on overhead, idle reserve or a rejected draft is a joule that cannot serve a customer. But the metric only earns that place with three disciplines attached: one energy boundary that includes cooling and electrical losses, a numerator that counts accepted work rather than raw tokens, and published conditions that let anyone repeat the measurement.
The providers who sell that way will look less exciting in a keynote. They will look a great deal better in a procurement review, which is where megawatts actually get paid for. Boulton sold power. The next generation of AI clouds will sell what each megawatt can prove it did.
FAQ/ Questions people ask
Questions people ask about tokens per watt
What does tokens per watt actually mean?
Tokens per watt is shorthand for token throughput divided by power, which reduces to tokens per joule of energy. Measured over the same period and at the same boundary, it tells you how much output a given energy budget produces. For planning, operators usually express it as tokens per second per megawatt; for energy accounts, as tokens per kilowatt-hour.
How do you convert tokens per joule into tokens per kilowatt-hour?
One kilowatt-hour contains 3.6 million joules, so multiply tokens per joule by 3.6 million. A system producing 0.0714 tokens per joule delivers about 257,000 tokens per kilowatt-hour. The conversion is only meaningful when throughput and average power come from the same observation period and the same measurement boundary.
Is cost per token still a useful metric?
Yes, when it is complete. A coherent cost per token allocates hardware, hosts, networking, storage, software, operations, electricity, cooling and idle capacity over a defined period and workload. Its limit is that it answers a cost question rather than a value question, so it should sit beside total cost per successful task.
Does a lower PUE always mean a more efficient AI data centre?
No. PUE divides total facility energy by IT energy, so it measures supporting infrastructure rather than computational efficiency. If better software halves the IT energy needed for the same work while overhead stays fixed, total energy falls from 100 units to 60 but PUE rises from 1.25 to 1.50. PUE should always be paired with a measure of productive output.
Why can power limit AI revenue when electricity is a small share of cost?
Because a site’s grid allocation caps how much hardware it can run. Once a facility reaches that limit, more output can only come from efficiency: more tokens per IT kilowatt and less overhead per IT kilowatt. In this article’s 10 MW example, a design with 20% better IT efficiency and a PUE of 1.15 instead of 1.40 produces about 46% more output from the same allocation.
How should a neocloud market tokens per watt to customers?
By selling the unit each customer actually buys rather than the chip: dated, energised capacity for model builders, latency-qualified throughput for product teams, and cost per successful task for enterprises. Every number should come with a published disclosure of the measurement boundary, the workload conditions and the energy, carbon and water per million tokens. Claims without stated conditions should be treated as advertising.
Sources/ Further reading
Sources and further reading
- [1]Satya Nadella on power, warm shells and chips in inventoryWccftech, 1 November 2025, reporting the BG2 podcast with Brad Gerstner and Sam Altman.
- [2]Tokenomics GuideNVIDIA. Current web edition, accessed 19 October 2026. Used for the industry’s explicit pairing of throughput per MW and cost per token and for its own critique of GPU-hour metrics, not for vendor performance comparisons.
- [3]Key Questions on Energy and AI: executive summaryInternational Energy Agency, April 2026.
- [4]Data Centres Metered Electricity Consumption 2025: key findingsCentral Statistics Office Ireland, published 7 July 2026.
- [5]Electricity 2026: gridsInternational Energy Agency, February 2026.
- [6]Proposed data centre connection reformsOfgem consultation document, 29 July 2026, executive summary. Queue figures describe June 2025.
- [7]Key Questions on Energy and AI (full report)International Energy Agency, April 2026, sections 4 and 5.1, pages 40 to 46, on power dynamics and electricity procurement.
- [8]What is MLPerf EndpointsMLCommons, developing v1.0 documentation, accessed 19 October 2026.
- [9]system_power.json referenceMLCommons. Documentation verified against developing rules on 2 October 2026; power-model elements marked pending ratification.
- [10]Measuring the environmental impact of delivering AI at Google ScaleElsworth and colleagues, August 2025. Table 1 and sections 3 and 4; measurement period May 2025.
- [11]The Gentle SingularitySam Altman, June 2025. Gives the 0.34 Wh figure without a stated methodology.
- [12]Best Practices Guide for Energy-Efficient Data Center DesignUS Department of Energy, Federal Energy Management Program. Revised July 2024; liquid cooling and benchmarking sections.
- [13]Cooling Water Efficiency Opportunities for Federal Data CentersUS Department of Energy, Federal Energy Management Program. Accessed 19 October 2026.
- [14]DistServe: Disaggregating Prefill and Decoding for Goodput-optimized Large Language Model ServingZhong and colleagues, USENIX OSDI 2024.
- [15]Splitwise: Efficient Generative LLM Inference Using Phase SplittingPatel and colleagues, ISCA 2024.
- [16]Diagnosing Inference Energy Consumption with the ML.ENERGY Leaderboard v3.0Chung, 29 January 2026.
- [17]Energy Considerations of Large Language Model Inference and Efficiency OptimizationsFernandez and colleagues, April 2025, arXiv 2504.17674.
- [18]MLPerf Power: Benchmarking the Energy Efficiency of Machine Learning Systems from Microwatts to Megawatts for Sustainable AIHPCA 2025; arXiv 2410.12032, version 2.
- [19]Jevons paradoxWikipedia, on Jevons’s observation that England’s coal consumption soared after the Watt steam engine improved on Newcomen’s design.
- [20]The Coal QuestionW. S. Jevons, Macmillan, 1865. Quotation as given in the Wikipedia article on the book.
- [21]Matthew Boulton quotationsToday in Science History, citing Boswell’s Life of Johnson (Birkbeck Hill edition), vol. 2, p. 459, entry for 22 March 1776. The original punctuation before POWER is a long dash.
- [22]Original indenture of agreement for erection of a rotative engineScience Museum Group collection. On the royalty of one-third of the saving in coal, and rotative-engine premiums based on the power replaced.
- [23]HorsepowerWikipedia, on James Watt’s adoption of the term to compare steam engines with draft horses.
- [24]Watt’s engine counter and framed diagramScience Museum Group collection, made 1785. On payment by pumping work performed and the dispute over short strokes.
- [25]GTC 2025 recapGlenn K. Lockwood, March 2025. On the power-normalised AI factory curves and “the more you buy, the more you make”.
- [26]Could Nebius become a trillion-dollar AI hyperscaler?Silicon Tales, 5 August 2026, citing the Nebius Q1 2026 shareholder letter on contracted and connected power.
Onur Sirin writes Silicon Tales and builds Loomiks.ai, a decision-engineering platform for enterprise AI.